Robot Density Explained: What the IFR Number Measures
Robot density compares operational industrial robots with manufacturing employment. It is useful, but revisions and small workforces can move the ranking.
Robot density relates operational industrial robot stock to the workforce. The International Federation of Robotics, or IFR, reports the measure as robots per 10,000 manufacturing employees so countries with different workforce sizes share a common base.[1]
The number is narrower than it sounds. It does not count every robot type, and it does not tell you how productive, safe or heavily used the machines are. It compares one stock figure with one employment figure.
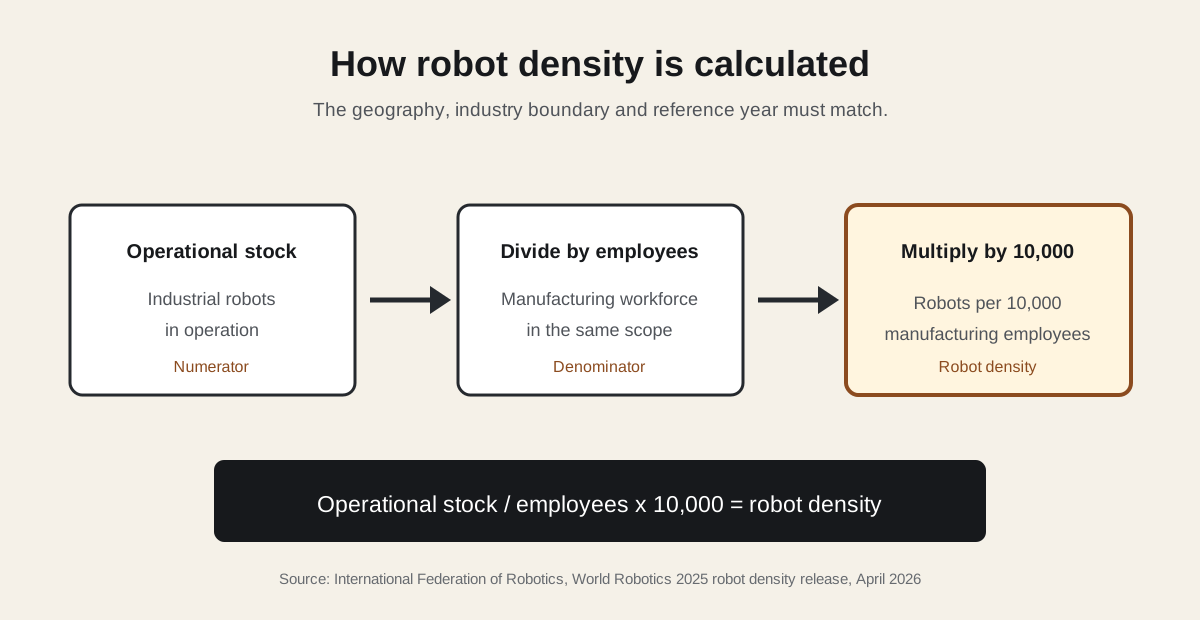
How is robot density calculated?
The formula is simple:
`robot density = operational industrial robot stock / employees x 10,000`
The numerator counts industrial robots in use, not robots installed during the latest year; the denominator is the employee count for the geography and industry covered by the data. IFR says the metric can cover all manufacturing or a specific industrial branch, so a national manufacturing figure and an automotive figure are not interchangeable.[1]
The scale factor makes the result readable. The United States recorded 307 robots per 10,000 manufacturing employees for 2024, equivalent to about one operational industrial robot per 32.6 employees. It is an economy-level ratio and does not mean every group of 33 people works beside one robot.
Robot density standardizes two totals. It does not describe the factory floor between them.
Which countries had the highest robot density in 2024?
The Republic of Korea led IFR's 2024 ranking at 1,220 robots per 10,000 manufacturing employees, followed by Singapore at 818, Germany at 449 and Japan at 446.[1]
Show data
| Republic of Korea | 1220 |
|---|---|
| Singapore | 818 |
| Germany | 449 |
| Japan | 446 |
| Sweden | 377 |
| Denmark | 329 |
| Slovenia | 315 |
| United States | 307 |
| Chinese Taipei | 302 |
| Switzerland | 294 |
The chart needs its denominator. IFR notes that Singapore can reach a high density with a small operational stock because its manufacturing workforce is small. Korea's 1,220 works out to about one robot per 8.2 manufacturing employees, while Singapore's 818 is about one per 12.2. These ratios do not give either country's total fleet.
China makes the opposite point. IFR put it at 166 robots per 10,000 manufacturing employees and 22nd worldwide, yet it had around 2 million operational industrial robots, the largest stock in the world, and took 295,000 of the robots installed worldwide during 2024.[1]
Why is robot density different from annual installations?
Annual installations are a flow, operational stock is the fleet still in use, and robot density takes that stock and divides it by employment. IFR reported 542,000 industrial robot installations worldwide in 2024 and an operational stock of 4,664,000. The stock was about 8.6 times the year's installations, so replacing one measure with the other changes the question.[3]
| Measure | What it counts | Useful question |
|---|---|---|
| Annual installations | Industrial robots installed during a stated year | How much new capacity entered the market? |
| Operational stock | Industrial robots in operation at a stated time | How large is the working fleet? |
| Robot density | Operational stock relative to the measured workforce | How concentrated is that fleet for the size of the workforce? |
A country can lead in annual installations without leading in density. Large manufacturing workforces raise the denominator, while smaller ones can produce a high ratio from a modest fleet.
Why did China's published ranking change so sharply?
IFR's 2024 release put China at 470 robots per 10,000 employees for 2023, ranking it third worldwide.[2] The April 2026 release put China at 166 for 2024 and 22nd worldwide, based on updated labor market data from China's National Bureau of Statistics.[1]
That break should stop readers from drawing a smooth trend across the two releases. IFR does not say in the cited pages that robots disappeared; its newer release says China's operational stock was around 2 million and that the country installed 295,000 robots during 2024. The denominator changed enough to alter the comparison. Our reading is that the 470 and 166 figures belong to different published data series, and readers should not turn them into a year-over-year trend without the detailed methodology behind both editions.
- 2016: IFR's 2024 release gives a global average of 74 robots per 10,000 manufacturing employees for this reference year.
- 2023: The same release gives a global average of 162 and China at 470.
- 2025-09: IFR publishes World Robotics 2025, reporting 542,000 installations and 4,664,000 operational industrial robots for 2024.
- 2026-04: IFR publishes 2024 density figures, including a global average of 132 and a revised China figure based on updated labor market data.
- 2026-09: IFR says it will publish World Robotics 2026 on September 24.
What can robot density tell you?
Robot density can compare the concentration of operational industrial robots across manufacturing economies when the scope and reference year match, and it can compare industries inside one country if each figure uses the same employment boundary.[1] It cannot tell you whether those robots run one shift or three: the formula contains no factory output, uptime, task complexity, age, purchase cost or safety result. Our reading: use density as an adoption ratio, then look for factory output, employment and operational evidence before claiming that one economy is more productive than another.
The reference year matters too. IFR publishes World Robotics annually and plans to release the 2026 edition on September 24, 2026.[4] A chart labeled only "robot density" is incomplete; it needs the year, geography, industry boundary and source edition.
How should you read the next robot density ranking?
Check four items before comparing the bars:
1. Confirm that every figure uses operational stock instead of annual installations. 2. Match the reference year and the edition that supplied the employment data. 3. Keep national manufacturing density separate from density for one industrial branch. 4. Read the denominator. A small workforce can lift the ratio even when the operational stock is modest.
Robot density earns its place because it corrects for economic size. The same correction creates its main weakness: a revised employee count can move a country's ratio even while its robot fleet grows. The ratio is useful only when its denominator travels with it.
Robot density: common questions
What does robot density measure?
Robot density measures operational industrial robots relative to manufacturing employment, usually as robots per 10,000 employees. It compares a robot stock with a workforce, not a count of annual installations.
Does a high robot density mean a country has the most robots?
No. A small manufacturing workforce can produce a high ratio from a smaller fleet. China illustrates the distinction: IFR reported the world's largest operational stock while its density ranking was lower.
Why can a robot density ranking change?
The ratio changes when either the operational robot stock or the employment denominator changes. IFR's revised labor market data for China changed its published comparison.
Sources
- https://ifr.org/ifr-press-releases/news/robot-density-surges-in-europe-asia-and-americas
- https://ifr.org/ifr-press-releases/news/global-robot-density-in-factories-doubled-in-seven-years
- https://ifr.org/ifr-press-releases/news/global-robot-demand-in-factories-doubles-over-10-years
- https://ifr.org/worldrobotics/